All projects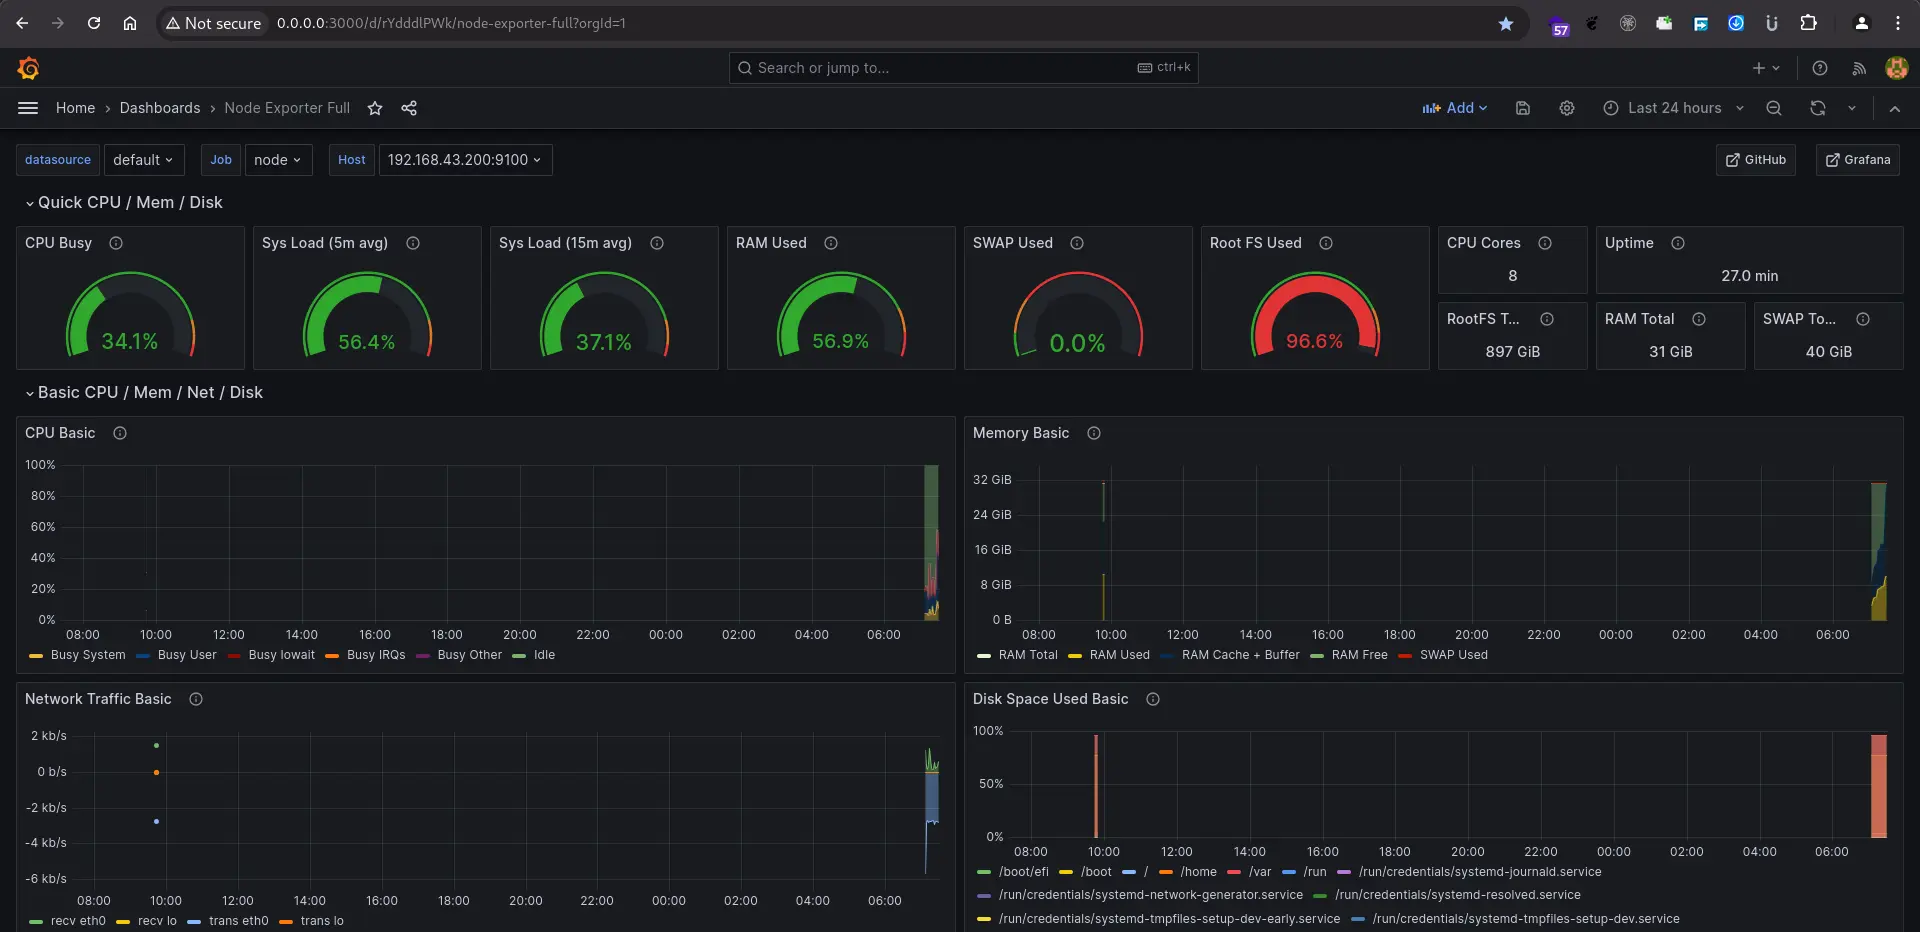
DevOps
Server Monitoring Stack
A server monitoring stack built with Node Exporter, Prometheus, Grafana, Redis, Alertmanager, and cAdvisor, later expanded with Nagios Core and Uptime Kuma for deeper observability.
- Type
- Lab project
- Category
- DevOps
- Role
- DevOps Engineer
- Duration
- 1 week
- 8
- Tools integrated
- 50+
- Metrics
The challenge
Setting up persistent storage, configuring Alertmanager, and integrating multiple monitoring tools.
The solution
Deployed a Docker-based stack with Node Exporter, Prometheus, Grafana, Redis, Alertmanager, and cAdvisor.
What it includes
- Node Exporter for metrics collection
- Prometheus for data storage and querying
- Grafana for visualization and dashboarding
- Redis for caching and real-time data
- Alertmanager for alerting and notifications
- cAdvisor for container resource utilization
Problems solved
- Setting up persistent storage for Prometheus
- Configuring Alertmanager for alerting
- Implementing Nagios Core for deeper observability
Technologies
- Docker
- Prometheus
- Grafana
- Alertmanager
- cAdvisor
- Nagios Core
- Uptime Kuma